The Georgia Department of Public Health recently released a full slate of data on what took Georgians’ lives in 2020, making it possible to fully compare COVID-19’s toll on our population with that of other illnesses. So just how bad was it pre-delta variant? The numbers below help answer that question by providing comparisons against our standard top killers and the virus typically called up as COVID’s comparison point: the flu.
It became one of our top causes of death
Over time, Georgia’s #1 killers tend to be related to our heart and circulatory system. The chart below, taken from Georgia DPH’s OASIS data portal, shows the 11-county region’s leading causes of death – defined here by age-adjusted death rate – for 2016 through 2020. Here, we can see that COVID-19 ranks #14. By comparison, it ranks #11 statewide. It’s worth underscoring that this data is based on five-year aggregates: This means that in just one year, COVID-19 took enough lives to get a ranking in our age-adjusted death rate, whereas all the other illnesses on this list have been taking lives since 2016.

Source: Georgia Department of Public Health OASIS’ Community Health Needs Assessment (CHNA) portal. Data downloaded August 26, 2021.
Mythbusting: COVID is WAY more deadly than the flu (for most of us)
“It’s no worse than the flu” is a refrain many of us might have heard, but the data simply doesn’t support the statement. Below, we’re comparing total deaths from COVID-19 and the flu. To put it bluntly, there is no comparison. And we even gave the flu an extra chance here – since 2020 was a very light flu year, we also looked at 2019 and 2013, the final of which was one of the harder-hitting flu seasons in the past 10 years on the national level.*
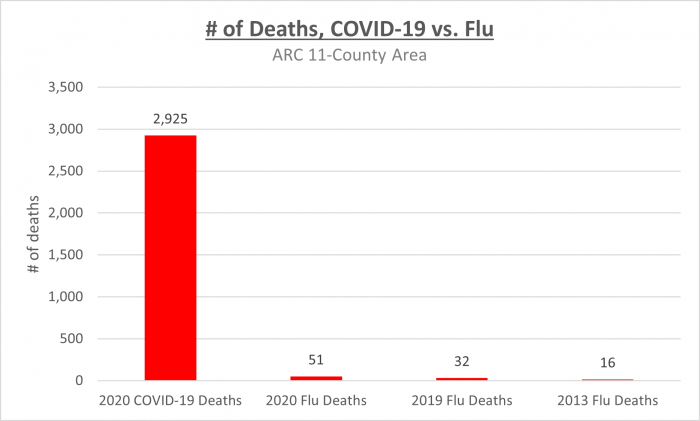
Source: Georgia Department of Public Health OASIS data portal. Data downloaded August 19 & 26, 2021.
*Flu seasons straddle two years – the 2012-2013 flu season was a hard-hitting one. To maintain consistent year-long analyses, we are using 2013 flu data because it had the larger number of deaths between the two years.
Since our population grows each year, we would expect to see increases in flu deaths over time. The data below controls for that by looking at different kinds of rates. In the case of the age-adjusted death rate, we’re looking at deaths per 100,000, with weights controlling for the fact that our population isn’t equally divided across age groups. The YPLL 75 rate looks at years of life lost per 100,000, and the percent of death by cause shows each illness as a percent of all deaths in the geographic area we’re looking at. Since we’re using rates, we can also make comparisons to the state.
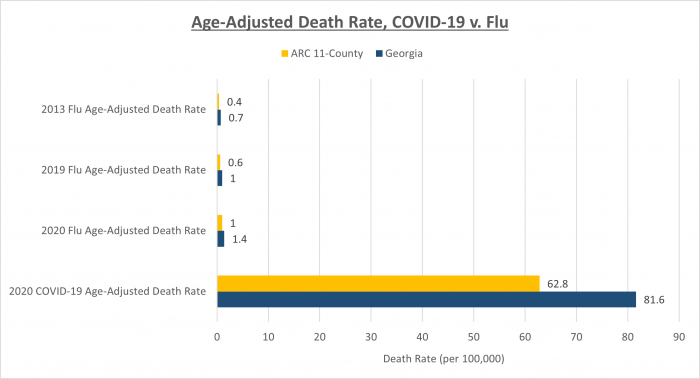
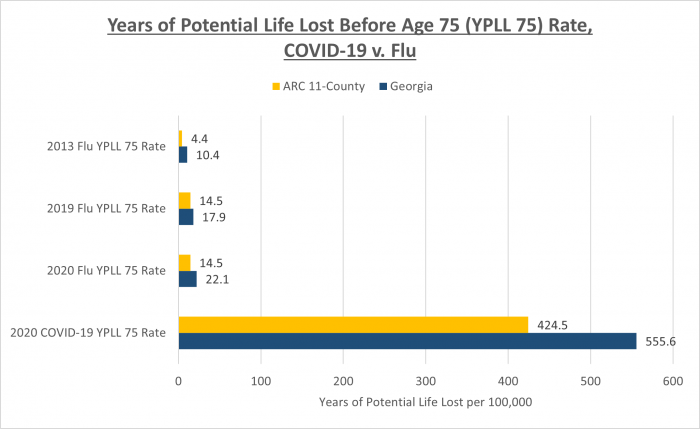
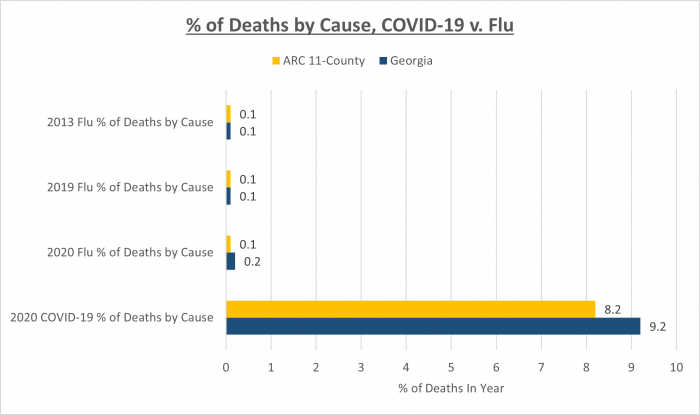
Source: Georgia Department of Public Health OASIS data portal. Data downloaded August 19 & 26, 2021.
The main takeaway? No matter which way you look at the data, there is no way to compare COVID-19 to the flu, at least when talking about the population at large. The one place where you can make a comparison in 2020 – back in the pre-delta variant days, COVID took the lives of 6 children statewide, and the flu took the lives of 4 children. With delta and the start of the 2021-2022 school year coupling to create a surge in schools, however, there’s a strong possibility that we’ll see less comforting statistics about 2021. Consider: On August 27, 2020, the state estimated that four children under age 18 had died of COVID-19. By August 26, 2021, the cumulative estimate stands at 24.
The numbers bear more resemblance to our #1 killer: heart disease
Over time, ischemic heart and vascular disease (that’s a narrowing of the arteries, and we’ll be abbreviating it to heart disease from here forward) has maintained a pretty stable place as the state and metro area’s #1 killer. The chart below compares the total deaths of COVID-19 and ischemic heart and vascular disease in 2020.

Source: Georgia Department of Public Health OASIS data portal. Data downloaded August 19, 2021.
Remember when we pointed out that COVID made it to #14 on the leading causes of death for a five-year period even though it had only been around for one year? The chart above and the ones that follow bring home the significance of this. In the sheer numbers above and the rates below, we can see that in 2020, COVID-19 outperformed heart disease in the business of death.
If nothing else, all this confirms what many, many, many people have already been saying since March 2020: COVID-19 is a serious illness that requires serious attention. When looking at the numbers like this, we could say that it’s worth the same level of gravity and intervention we’d give to ourselves if we were told we are facing heart failure.
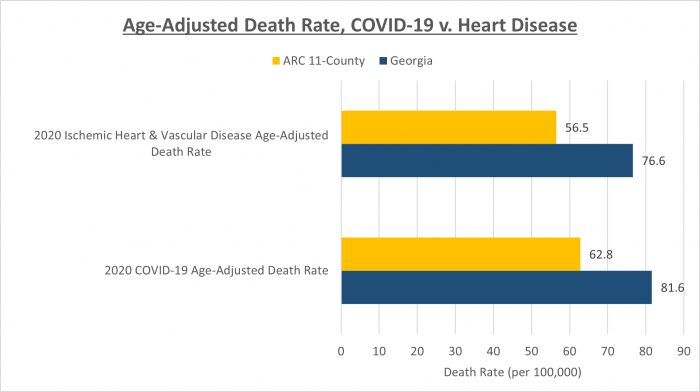

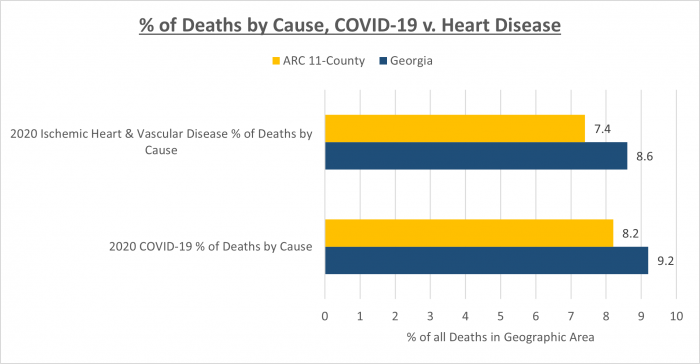
Source: Georgia Department of Public Health OASIS data portal. Data downloaded August 19, 2021.
Statewide, some counties can attribute around a fifth of their deaths to COVID-19
The close observer might by now have noticed that the 11-county area, while hit very hard, did not fare as badly as the state when it came to metrics around COVID-19 deaths. Just how different is the lay of the land? The map below shows the percent of all deaths in a county that are attributed to COVID-19. We can see that many of ARC’s 11 member counties fall into the middle percentiles of deaths caused by COVID-19. The counties with the greatest percentage of deaths attributed to COVID-19 were Jenkins, Hancock, Glascock, Randolph and Dodge, all of which had 20 percent of more of deaths caused by COVID-19.

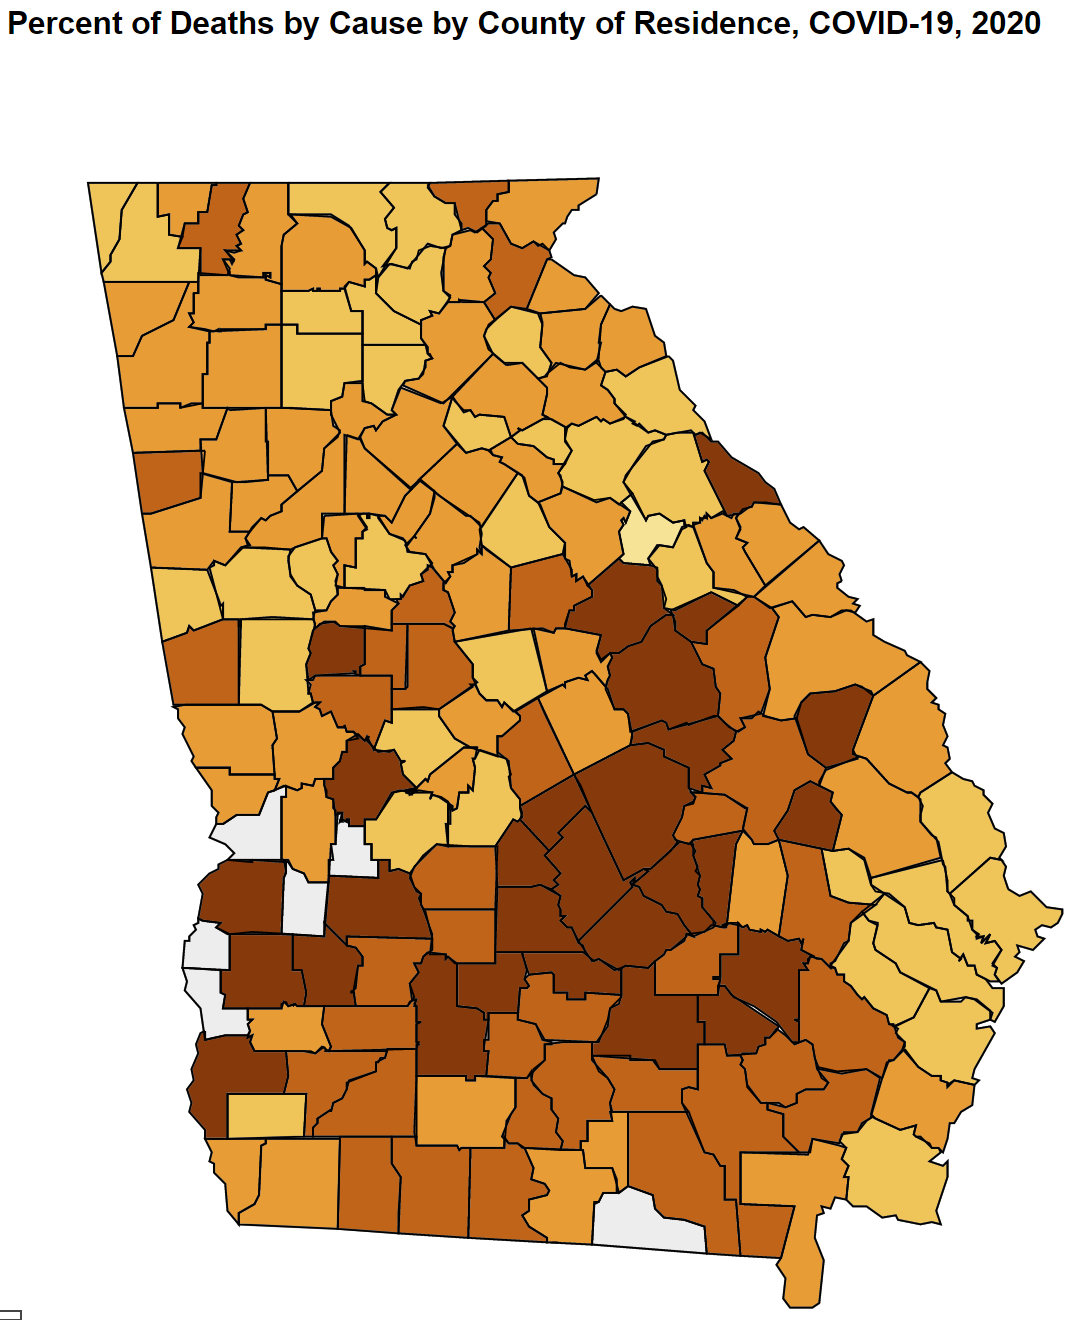
Source: Georgia Department of Public Health OASIS data portal. Data downloaded August 19, 2021.

