Transportation Tuesday: Long commute – driving alone

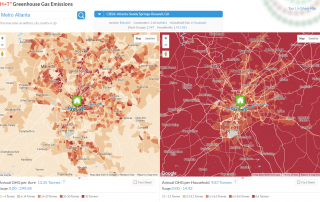
This map shows neighborhoods in metro Atlanta where the mean travel time to work is between 30 - 45 minutes, and where 85% or more of commuters drive alone to work. Driving alone on a long commute is considered a health factor by County Health Rankings. "A 2012 study in the American Journal of Preventive Medicine found [...]

By |2016-12-08T15:24:51-05:00August 30th, 2016|Public Health, Transportation, Transportation Tuesday|Comments Off on Transportation Tuesday: Long commute – driving alone

Transportation Tuesday: Greenhouse Gas Emissions

Using The Center for Neighborhood Technology’s Housing +Transportation (H+T®) Affordability Index mapping tools, the images below show greenhouse gas emissions throughout metro Atlanta. The data use transportation and household factors to model annual greenhouse gas emissions per acre (left) and per household (right).  The emissions per acre map shows higher concentrations in the urban core and along [...]

By |2016-12-08T15:24:51-05:00August 23rd, 2016|Public Health, Transportation, Transportation Tuesday|Comments Off on Transportation Tuesday: Greenhouse Gas Emissions

Transportation Tuesday: Freight Mobility Plan Update

The Atlanta Regional Commission (ARC) recently adopted an update to the Atlanta Regional Freight Mobility Plan that features short-term and long-term strategies to enhance the movement of freight in metro Atlanta.  The plan includes $1.8 billion in targeted road and highway improvements scheduled to begin construction in the next 5 years, as well as recommendations [...]

By |2016-12-08T15:24:51-05:00August 16th, 2016|Transportation, Transportation Tuesday|Comments Off on Transportation Tuesday: Freight Mobility Plan Update

Transportation Tuesday: Affordability for a family of three with one worker

We recently shared a map that shows location affordability (based on housing and transportation costs) for a Type 1 Family (a family of four, including two working commuters, with a median annual household income of $57,740). This new map shows both the Type 1 Family data and affordability for a Type 7 Family:  a moderate income [...]

By |2016-12-08T15:24:51-05:00August 9th, 2016|Transportation, Transportation Tuesday|Comments Off on Transportation Tuesday: Affordability for a family of three with one worker

Transportation Tuesday: July’s Worst Traffic Jams (map)

Where were the worst traffic jams during July? This map shows the top 10 bottlenecks along metro Atlanta highways for the month of July. A bottleneck is a segment of roadway where the traffic speed has dropped below 60% of the historical referenced speed for at least 5 minutes. INRIX ranks bottlenecks based on their [...]

By |2016-12-08T15:24:52-05:00August 2nd, 2016|Transportation Tuesday|Comments Off on Transportation Tuesday: July’s Worst Traffic Jams (map)

Transportation Tuesday: Housing + Transportation Affordability

This map was developed by the Atlanta Regional Commission using data from the U.S. Department of Housing and Urban Development's Location Affordability Index to show the affordability of housing and transportation costs, as a percentage of income. This map uses census tracts in metro Atlanta to show spatial trends in affordability. This map evaluates transportation and [...]

By |2016-12-08T15:24:52-05:00July 26th, 2016|Transportation Tuesday|Comments Off on Transportation Tuesday: Housing + Transportation Affordability

Transportation Tuesday: AmericasMart

Today marks the last day of AmericasMart, one of downtown Atlanta's big events. How has the influx of visitors affected traffic downtown? While we can't correlate traffic conditions directly with AmericasMart opening times, we can look at general traffic conditions nearby to get an idea of roadway congestion. The charts below use INRIX data to take [...]

By |2016-12-08T15:24:52-05:00July 19th, 2016|Transportation Tuesday|Comments Off on Transportation Tuesday: AmericasMart

Transportation Tuesday: Georgia Teen Drivers

The number of teens drivers has hit a record low, according to data from the Federal Highway Administration. In 2014, there were about 8.5 million teenage drivers in the U.S. How does this trend look for Georgia drivers? Source: U.S. Department of Transportation Federal Highway Administration, Highway Statistics Series

By |2016-12-08T15:24:52-05:00July 12th, 2016|Transportation, Transportation Tuesday|Comments Off on Transportation Tuesday: Georgia Teen Drivers

Transportation Tuesday: June’s Worst Traffic Jams

Where were the worst traffic jams in June? Some of these may look familiar- this month's report shows seven recurring bottlenecks that have been in the top 10 for April and/or May. The #1 bottleneck was I-75 N @ Chastain Rd/exit 271, for the third month in a row. The average maximum length of this [...]

By |2016-12-08T15:24:53-05:00July 5th, 2016|Transportation Tuesday|Comments Off on Transportation Tuesday: June’s Worst Traffic Jams

Transportation Tuesday: Commuting to Cumberland

Last week we looked at Emory as a regional employment center. This week, we analyze the travel patterns for workers in the Cumberland area using the U.S. Census Bureau's OnTheMap Application (with 2014 data).

By |2016-12-08T15:24:53-05:00June 28th, 2016|Transportation Tuesday|Comments Off on Transportation Tuesday: Commuting to Cumberland
Go to Top