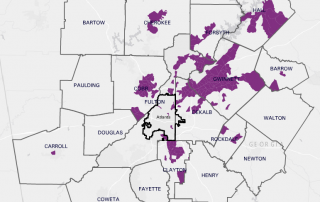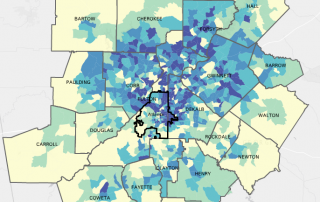
Monday Mapday: Change in Mortgage Loans, 2012 – 2015
The locations in dark blue had the greatest increase in the number of mortgage loans originated for buying homes per square mile from 2012 to 2015. The greatest increase in loans were concentrated in the northern parts of the City of Atlanta, extending up through Fulton, DeKalb, Forsyth, Gwinnett, and Cobb Counties. Source: HMDA, [...]