
In July 2014, we looked at home prices in metro Atlanta and found that while the area had made improvements, it has not completely recovered from the Great Recession. Two years later, we wanted to revisit the topic to see how our housing market is performing today. Our findings suggest that while some areas have made tremendous recoveries, there are areas, mainly concentrated in the southern part of the metro, that are struggling to bounce back. The highlights of this month’s Regional Snapshot are below, but we’d encourage you to check out the full report here!
- Atlanta Case-Shiller home price index is still six percent lower today compared to its pre-recession peak (July 2007). This is an improvement from our last report in 2014. Atlanta home prices were 13 percent lower in 2014 than the pre-recession peak.
- While there is some building permit activity in the southern metro counties, the heaviest building permit activity can be seen in the City of Atlanta and Fulton, Forsyth, Gwinnett, Cherokee and Cobb counties.
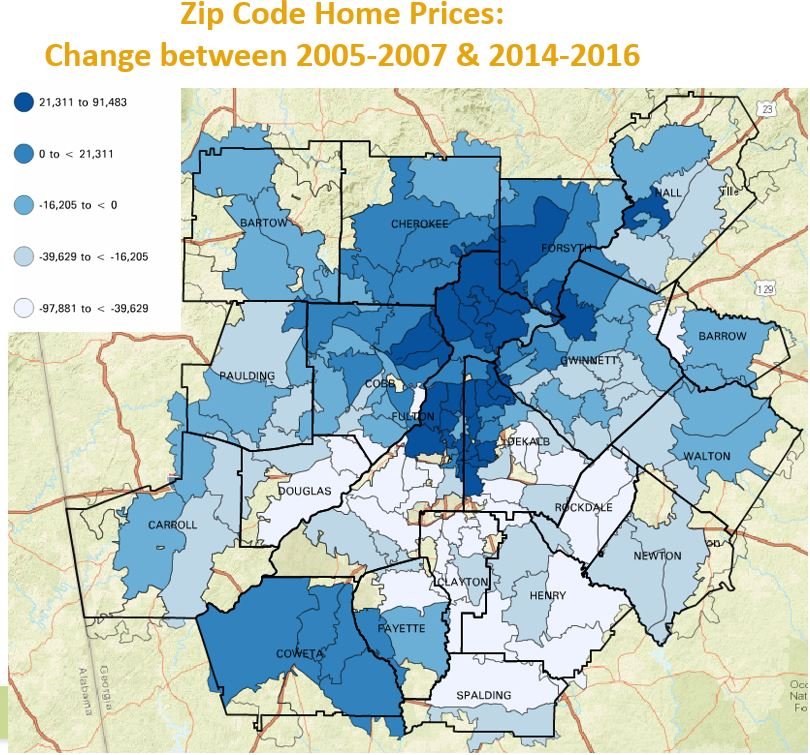
- On the county level, median home sale prices are generally still below the pre-recession averages. Cherokee, Cobb, Coweta, Forsyth, Fulton and the City of Atlanta are among the exceptions and have seen increases in median home sale price since the pre-recession peak. While we are still trying to recover, this is an improvement from our last home price report in 2014. Additionally, all counties, with the exception of DeKalb, have higher home prices this year (2016) compared to last year.
- The trends in monthly median rent are, not surprisingly, reflective of median home prices. The most expensive median monthly rents are found in northern Fulton and DeKalb- north of I-20. The zip code 30327 has the highest average median rent of $4,760.