
So tomorrow’s Halloween (stop the presses!). Before the goblins and gremlins start traipsing around your neighborhood in all their fantastical finery, we are here to help assess what trick-or-treater traffic volume you might statistically expect. The finding: It depends on where you live. And in general, the volume’s going down.
The Census Bureau tells us that the prime trick-or-treating ages are children aged 5 to 14. (Aside: they tell us a lot more about Halloween, take a look.) Using that age group as estimated by ESRI Business Analyst data, we mapped counties with 15 percent or more of their population age 5 to 14 … and what we see (below) are higher concentrations of trick-or-treater density in the Midwest and West (and Texas) than in the Southeast and very few hot spots for candy consumption in the Northeast.

Below, let’s zoom to the Southeast, where we can get a close look at Georgia — only a few counties jump out with 15% or more of the population between 5 and 14 . They are all inside or on the cusp of metro areas. Two of the shaded areas are Forsyth and Paulding in the Atlanta metro; for more on them, keep reading.

Now to the Atlanta area: Below we see some concentrations of trick-or-treater density in suburbs — along GA-400 to the north, I-85 to the northeast, and I-75 to the northwest. There are only a few large pockets of 5-14 concentrations in the Atlanta metro south of I-20.

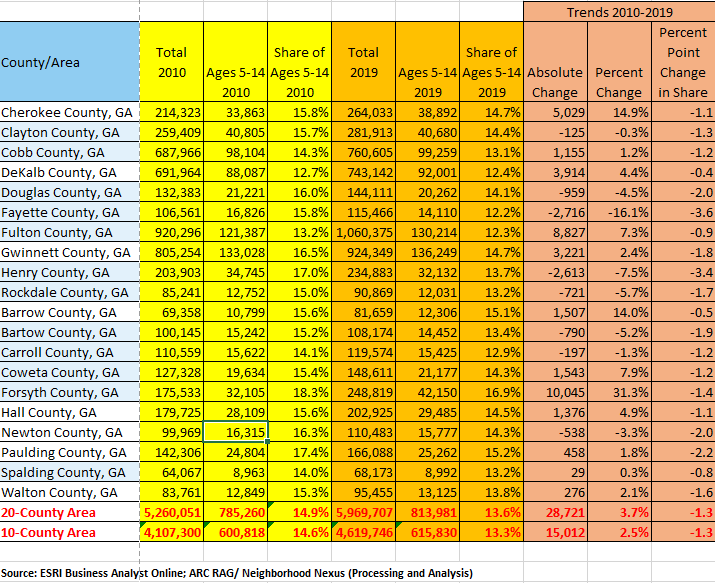
Enough with these menacing maps and on to terrifying tables! The one below shows growth in and concentration of the 5 to 14 demographic across all 20 counties of the Atlanta travel modeling area. In that area, looking at the 5 to 14 grouping, there are nearly 814,000 scary encounters possible tomorrow evening … way, way, way fewer if it rains. There’s not too much difference in 5 to 14 shares for 2019 in the 10 counties of ARC (13.3 percent) and across the larger 20-county area (13.6 percent). Among the 20 counties, there’s a lot more variation, with Fayette at the low end (12.2 percent) and Forsyth seeing the highest share of ages 5 to 14 (16.9 percent). Only 3 of the 20 counties — Forsyth, Paulding, and Barrow — have 15 percent or more of their population fall into the trick-or-treating target tranche.
Change over time (from 2010 to 2019) shows that Forsyth County had a net gain of over 10,000 persons age 5 to 14, which is about 35 percent of the entire net increase in the 20-county population. Now, that’s in a county that is only about 4 percent of the 2019 total 20-county population. Over the period of 2010-2019, though, the share of persons age 5 to 14 fell in every single one of the 20 counties, and eight actually experienced a net decline in population age 5 to 14, led by Fayette, which had a net loss of 2,700 followed closely by Henry at a loss of 2,600.
And now to close the creaky dungeon door on this post: a look at subcounty areas. In the final table below, the trends of widespread declines in the 5 to 14 demographic are again apparent. Of the 945 tracts across our 20-county area, 412 of them (44 percent) had a net loss in those age 5 to 14 between 2010 and 2019. The trick-or-treating target tranche declined in 18 of 20 census tracts in Fayette, 19 of 25 in Henry, and 12 of 20 in Douglas. Conversely, persons aged 5 to 14 increased in 82 percent of Forsyth tracts, 69 percent of Fulton tracts, and 61 percent of Gwinnett tracts.
