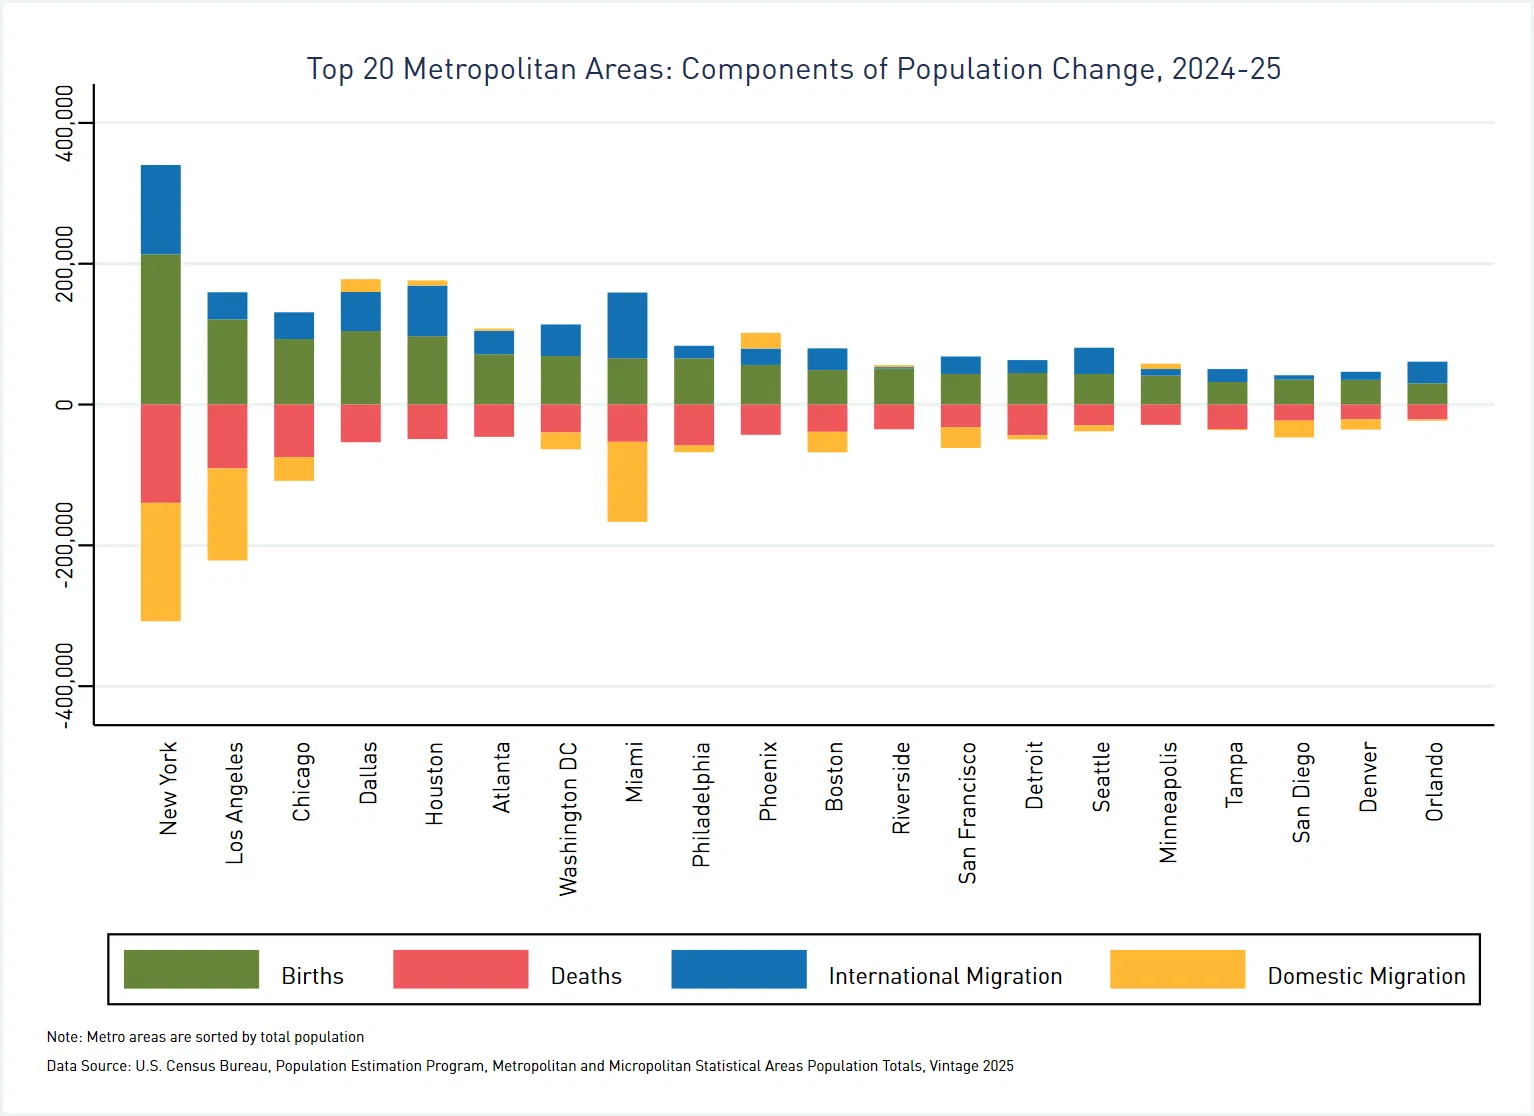
Stacked bar graph displaying population change by component in the top 20 metros for the period 2024-25 utilizing the Census Bureau’s vintage 2025 population estimates

Stacked bar graph displaying population change by component in the top 20 metros for the period 2024-25 utilizing the Census Bureau’s vintage 2025 population estimates