Recently we looked at Atlanta’s cost of living as measured by C2ER’s Cost of Living Index (COLI) and examined the large role housing plays in overall cost of living. This post is designed to enhance our understanding of the metro’s housing landscape using ACS data from our 100 Metros dashboard, which provides a larger array of metrics around housing and development in the country’s 100 most populous metro areas.
Quick facts
Total Housing Units
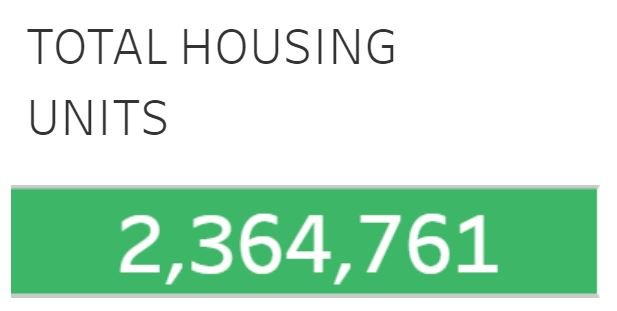
Atlanta is the 9th largest MSA in terms of total population as well as total housing units.
Housing Vacancy
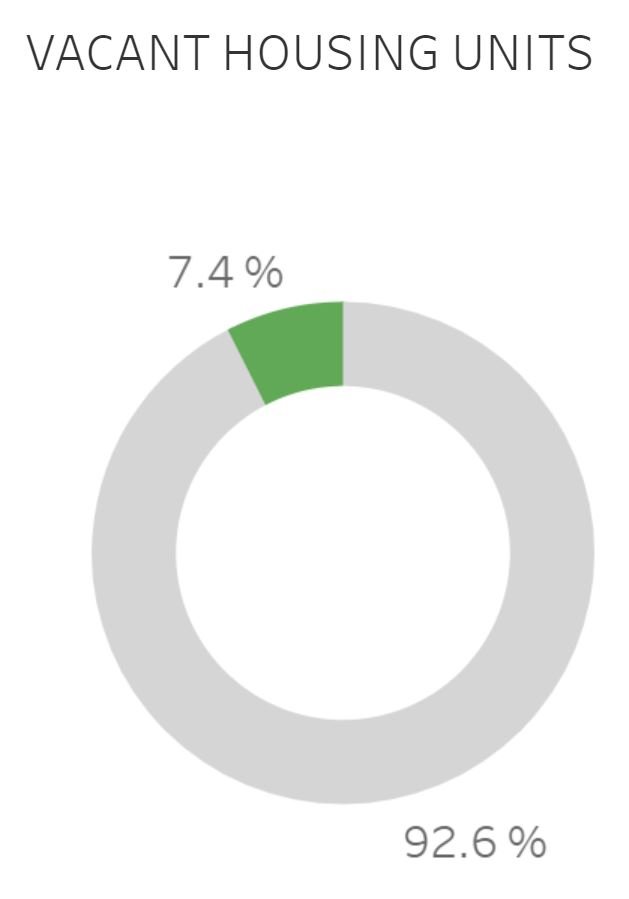
Our 7.4 percent vacancy rate places us at position #72 for vacancies. The #1 vacancy rate in the country is in the Cape Coral-Fort Myers, FL metro, which has a vacancy rate of nearly 30 percent, perhaps due to its volume of vacation rental property. In fact, eight of the top-10 metros for vacancy rate are in Florida.
Housing Tenure
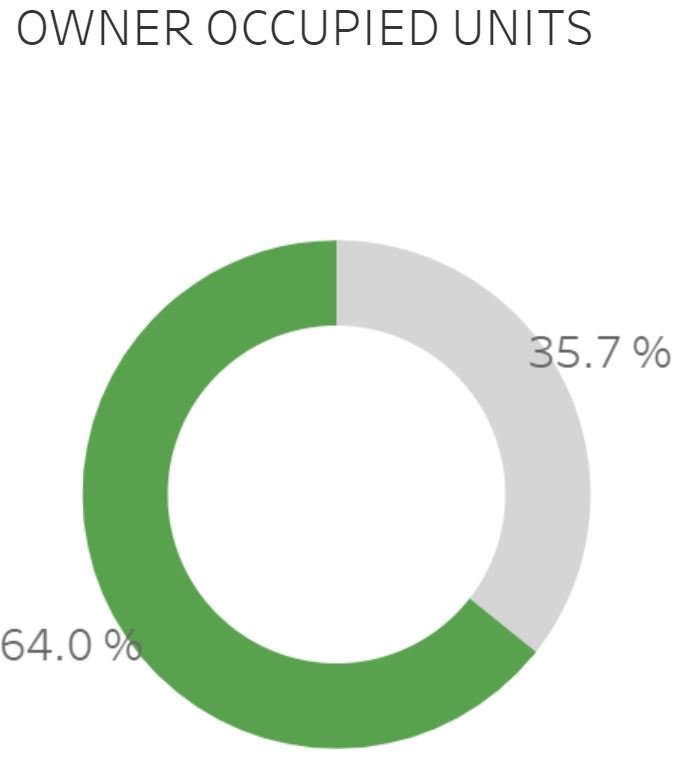
Our owner-occupied housing rate of 64.3 percent puts us at position #56 of 100 metros. The #1 owner-occupied rate is Florida’s Palm Bay-Melbourne-Titusville metro, where 77.5% of homes are owner occupied. Last place (#100) goes to Los Angeles-Long Beach-Anaheim, where just 48 percent of homes are owner occupied.
Cost Burden
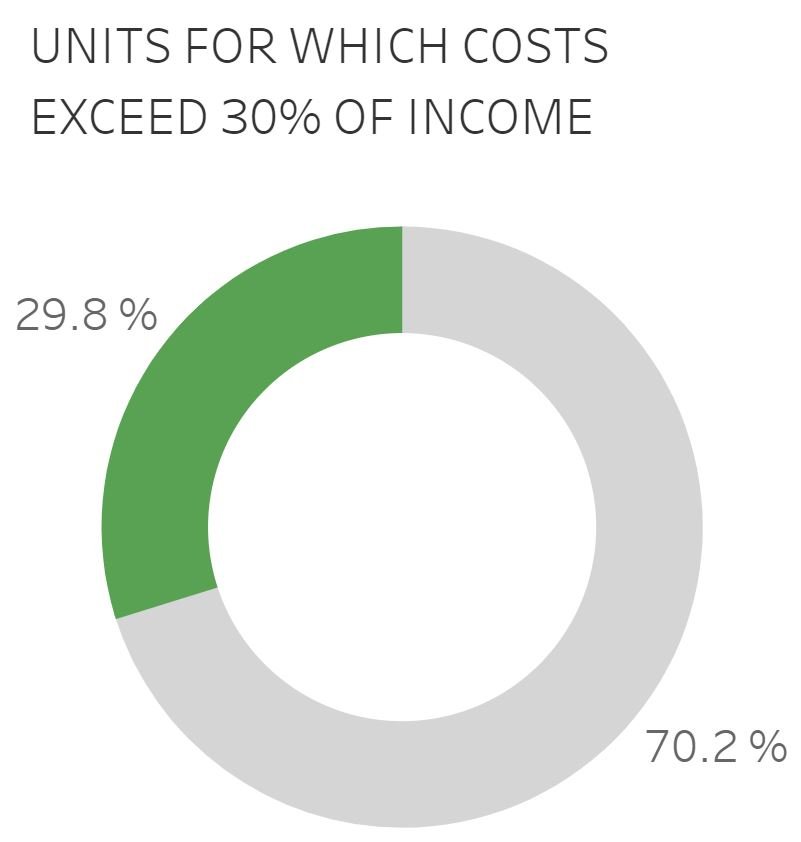
Experts typically recommend that housing costs (which includes things like utilities) not exceed more than 30% of a household’s income. Spending more is defined as housing cost-burdened. In the Atlanta MSA, about 30 percent of all housing units (renter- and owner-occupied) are cost burdened, which is #48 of 100 metros. Position 1 goes to the L.A. metro, where nearly 45 percent of households are cost burdened.
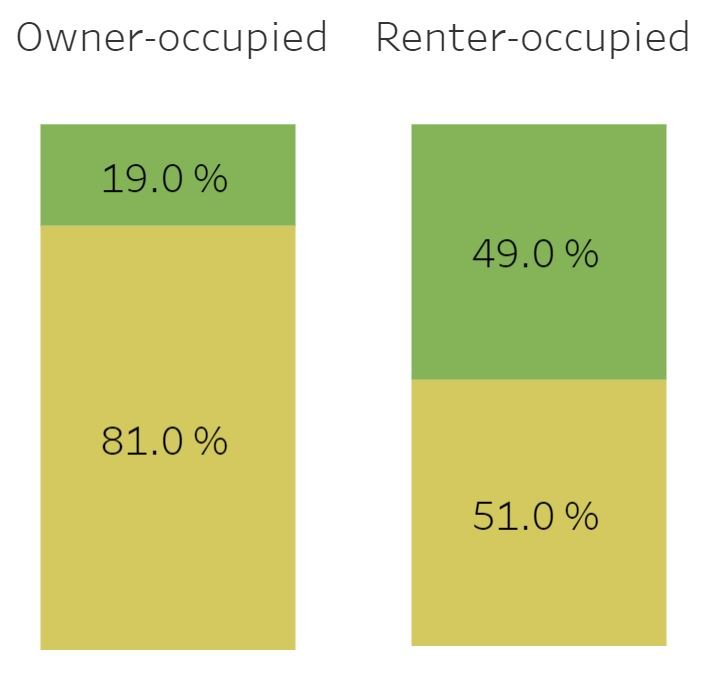
When comparing shares of housing cost burden between owners and renters, we can see that nearly half of the MSA’s renters are cost-burdened. While this is a lot, it doesn’t even come close to the top cities. The Miami MSA is #1 for cost-burdened renters, with nearly 62 percent of its renters spending more than 30 percent of their income on gross rent.
Building Permits
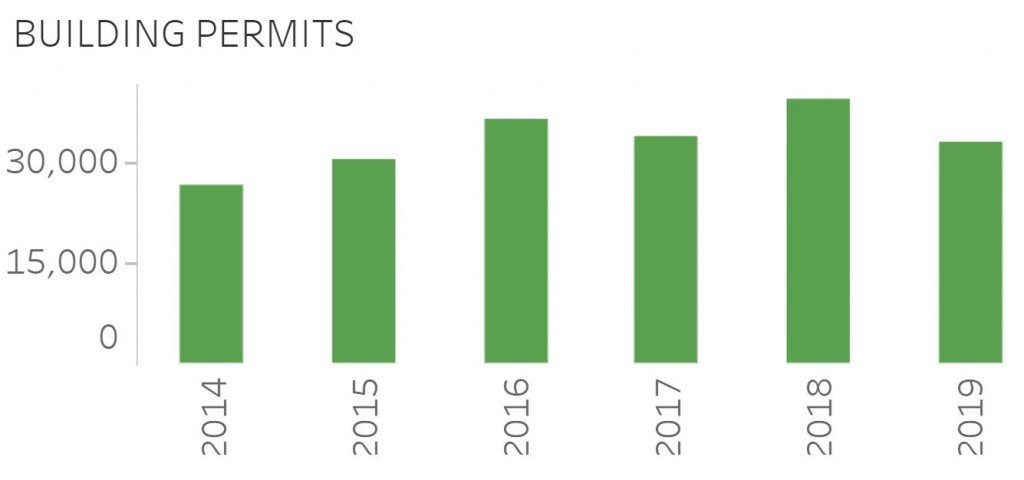
In 2014, Atlanta had 26,683 housing building permits issued; in 2019, the number was 32,836. The 23 percent difference between 2014 permits issued and 2019 permits issued is middling among the 100 metros, putting us at #52. The #1 percent difference was in Central Florida’s Lakeland-Winter Haven metro, where there were 241% more permits issued in 2019 than 2014.

