The Census Bureau recently released 2022 population estimates for all counties in the nation. Growth is picking up, slowly, out of the pandemic–and is happening at faster rates in exurban, suburban, and rural areas than in cores of metros–though less so in the last year (2021-22) than in 2020-21. So we are doing what we do and localizing the look at that new data release. First, for a historic framing of the ARC 11 counties, we offer Figure 1 below, which demonstrates that–for all but suburban counties such as Cherokee and Forsyth, the 1990s, 2000s, and 2010s (to a lesser extent) show a stronger “upward slope” of positive population growth than does the 2020-22 period. Figure 2 makes these trends more explicit by offering some specific 2020-2022 growth numbers for aggregated areas. Overall, growth was much slower for all areas shown in the 2020-2021 period—at only 66,000 statewide. Yet there is most notably a slower increase in the 11-county area (just over 15,000). Importantly and counter to historic trend, there was more 2020-21 population growth 2020-21 than in the ARC region not only in exurban counties (e.g. Barrow, Bartow, Carroll, Coweta, Dawson, Hall, Newton, Paulding, Spalding, Walton) but also in the rest of the state (outside ARC’s 21-county modeling area). Growth statewide in next period of 2021-22 roughly doubled to over 125,000, and the increase more than tripled for the 11-county area (from 15K to 50K increase). Meanwhile, growth 2021-22 in the exurban counties of the 21-county stayed fairly close to 2020-21 levels, as did the annual increase in the rest of the state (outside ARC’s 21-county modeling area).
Figure 1: Census Population Estimates 1990-2022: 11 Counties of ARC (Source: Census Population Estimates Program; ARC Research & Analytics)

Figure 2: Census Population Estimates Since 2020 Census: The Big Picture for GA and Atlanta (Source: Census Population Estimates Program; ARC Research & Analytics)

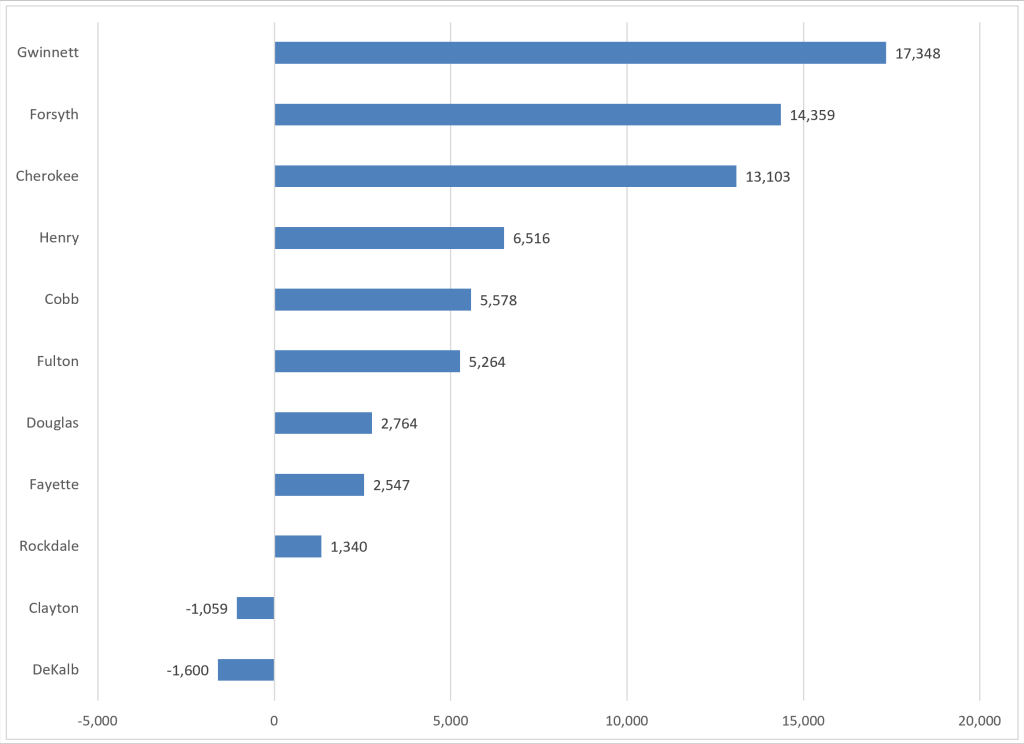
Now let’s take a deeper look at county-level trends since the 2020 Census. Figure 3 shows the 2020-2022 trends as a whole. The headlines appear to be a drop-off, according to the Bureau, in growth (compared to pre-pandemic) for Fulton and DeKalb, with stronger growth in the suburbs of the ARC region. This fits with a national narrative of “less urban draw” in the pandemic and aftermath. But –as per that narrative–it has to be noted that this trend does NOT indicate that the same people are moving out of the Atlanta core and into the Atlanta suburbs–it suggests only that the suburbs are attracting more migrants from multiple places (generally outside the region) than is the core.
Figure 4 breaks down the growth by year to show that the “negative trend” for core counties was focused almost entirely during the “prime” pandemic period of 2020-21 as opposed to the 2021-22 period. The suburban counties’ (e.g. Cherokee and Forsyth) net increase held fairly steady year to year over the period. But for core counties like Cobb, Fulton, and DeKalb, there was a strong bounceback in the 2021-22 period.
Figure 3: County Level Estimates 2020-2022 (Source: Census Population Estimates Program; ARC Research & Analytics)

Figure 4: County Estimates: 2020-21 and 2021-22 (Source: Census Population Estimates Program; ARC Research & Analytics)

And closing with something very worthy of note: the Census Bureau also estimates the type of population growth that comprises the total trend. There are three types of ways (nested in “components”) for subnational population to grow: (1) a surplus of births over deaths: “natural increase”; (2) more people moving into the area from outside America than the number moving out of the country from that area: “net international migration”; or (3) more people moving into the area from elsewhere in America than the number moving out of the area to other places in America: “net domestic migration”.
The breakdown by type over the last two years in aggregate (across various area groupings) is shown in Figure 5. Now, there is a lot to unpack in the table, but making only a few key points here: (a) natural increase is only slightly positive in the 11-county area 2020-22 and negative in the rest of Georgia–that is to say, most of the counties in Georgia have had more deaths than births 2020-2022; (b) international migration is starting to pick up in all areas; (c) domestic migration is very minimal in the ARC Region but has occurred at much higher levels in the Atlanta exurbs (primarily) and in the rest of the state.
Figure 5: County Estimates by Growth Components: 2020-22 (Source: Census Population Estimates Program; ARC Research & Analytics)


