
If you haven’t heard, a rather large sporting event is set to take place this Sunday: Super Bowl LVII! If your Roman numerals are rusty, that’s the 57th installment of America’s greatest sports spectacle, and it will feature the Kansas City Chiefs and the Philadelphia Eagles. And while we feel confident that passes will be thrown and points will be scored, we’re really not football experts over here at 33°N.
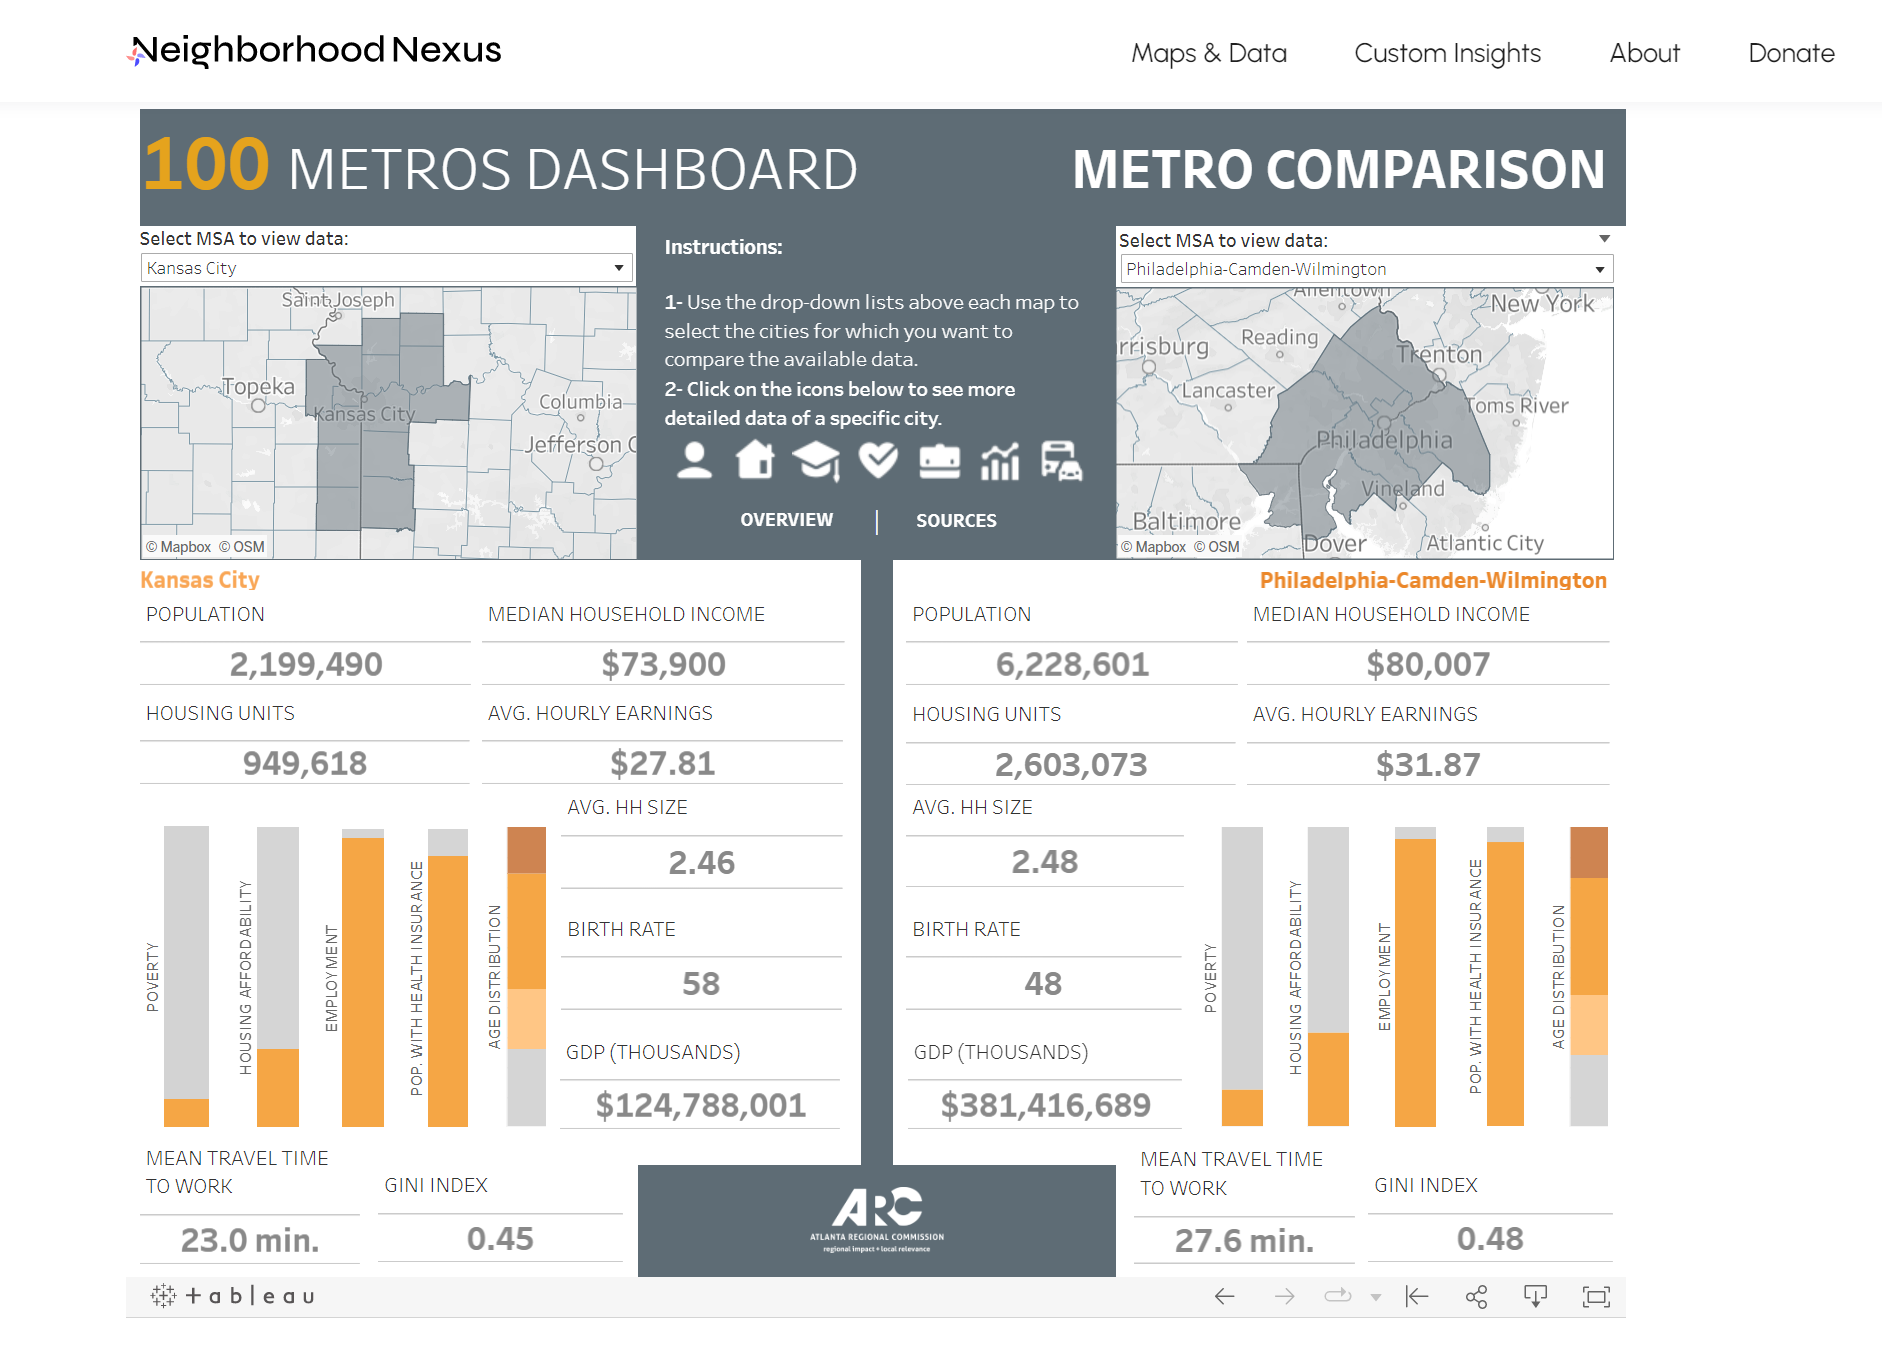
We’ve decided to take a look at Sunday’s matchup, not between two teams, but two cities. While the Chiefs and Eagles are set to face off on the field, what can we say about their respective metropolitan areas? To explore this question, we’re using a series of visuals, the first being from our proprietary 100 Metros Dashboard. The visual below shows a quick, high-level summary of the two metros (and keep in mind, shameless plug, that 98 other regional comparisons are easily available using the link!).
The next set of visuals come from Lightcast, a source of labor market data. Below is a table showing population, cost of living, workforce, and crime data for the two cities. For this table, keep in mind that the Cost of Living Index is relative to a value of 100, corresponding to the national average.

Finally, we have compiled data to show how the metro areas compare when considering the number of jobs across all industry sectors.

Philadelphia, with a population nearly three time that of Kansas City, features a higher median household income and slightly higher percentage of residents with a bachelor’s degree, but also a higher cost of living. And we note that the Kansas City metro area features significantly higher crimes, both violent and related to property, when compared to crime rates in Philadelphia. Finally, Kansas City saw sharp declines in jobs in both the Information and Utilities sector from 2010 to 2020, while both metro areas saw large increase in jobs in the Transportation and Warehousing sector between that time frame.
And now, onto the game. May the best team win!