
In August, we reported on the first phase of a then-new survey from the U.S. Census Bureau: the Small Business Pulse Survey (SBPS). For the phase 1 data insights, please click here. And now…there’s MORE! The Census Bureau has continued to track the effect of the Coronavirus Pandemic on small businesses in U.S. There are now three phases in the SBPS data release — two completed and one planned:
- The first phase of the SBPS tracked weekly changes for nine weeks starting in late April and ending in late June; the goal was assessment of COVID-19 impacts on small business operations, including employment, revenue, and supply chain disruption.
- The now-completed second phase of the survey asked about even more topics, including small business rehiring of previously furloughed or laid-off employees, the use of online platforms to offer goods and services, and about factors that affected capacity. This phase also covered nine weeks, from August 9th until October 12th.
- The third phase was recently authorized by the U.S. Office of Management and the Budget and will start in November 2020.
Neighborhood Nexus has recently created and published an interactive dashboard using data from both the first and the second phase of the SBPS to examine how small businesses in Atlanta have fared so far in the pandemic. This dashboard provides an easy way to see the trends in answers across phases.
Below we’ve collected screen shots of critical insights from the dashboard. Click here to explore the full dashboard.
How has this business been affected by the COVID-19 Pandemic?
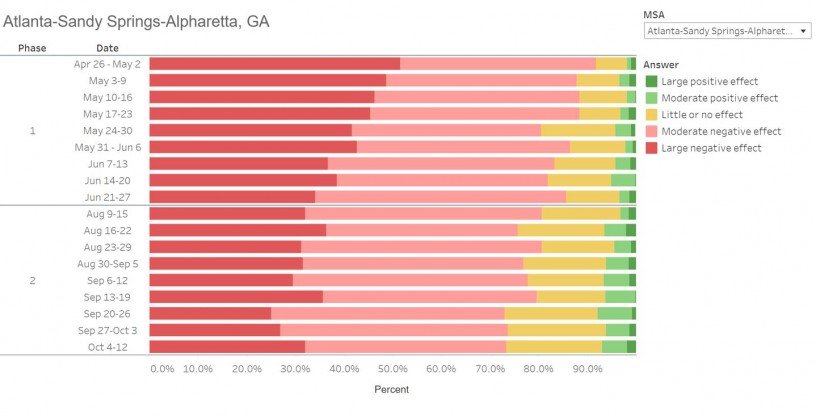
It appears that the extent of negative effect from the pandemic has diminished over time. The graph above shows that the percentage share of respondents who answered “large negative effect“ has decreased, especially during phase 2. While the share of those noting a “moderate negative effect“ has not changed, the shares of “Little or no effect” and “Moderate positive effect” have increased.
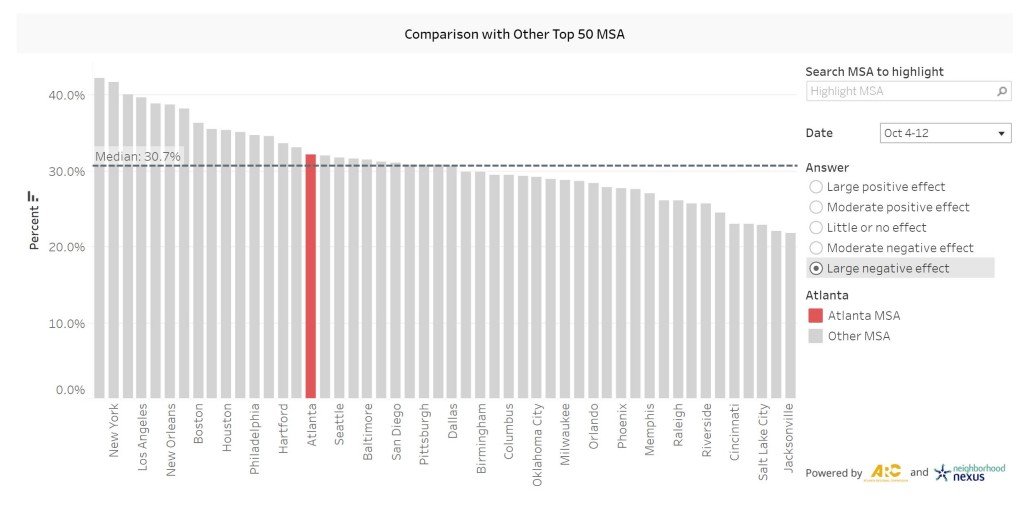
The bar graph above illustrates the percent share of the selected answer (“large negative effect” in this case) in order (from greatest to least) for the top 50 MSA regions in the selected week (the week of October 4-12). Although the share of “large negative effect“ responses in Atlanta has decreased over time, our share is still above the median, just as it was during the first week of the survey (the week of April 26-May 2).
Given that the most frequent response was “moderate negative effect,” Atlanta small business perception of COVID-19 overall impacts are still predominately and consistently negative (more than 70 percent), though the share of area small businesses feeling a “large negative effect” has declined.
In the last week, did the business experience a change in operating revenues?
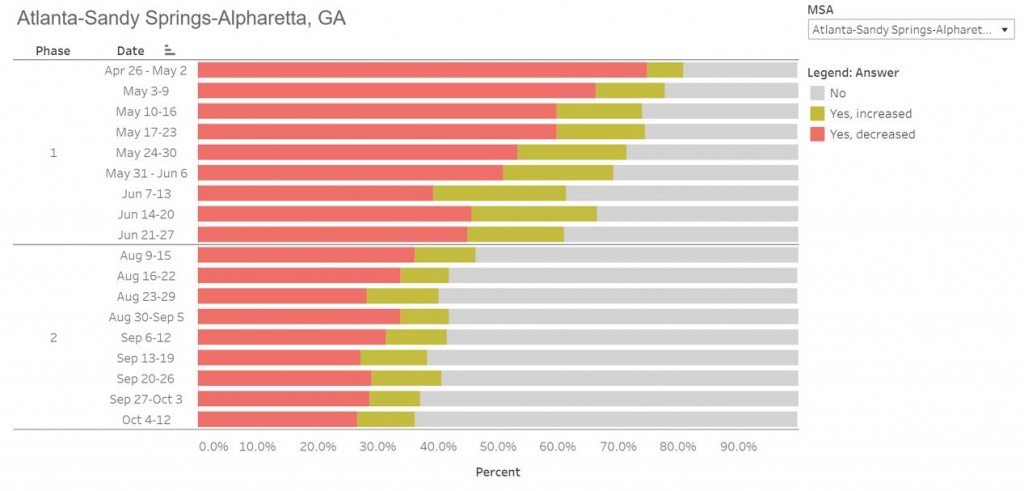
Now let’s look at assessment of change in business revenues. It is clear that the share of businesses perceiving a “revenue decrease“ has dramatically decreased over time and across phases, from 74.8 percent (for the week of April 26) to 26.6 percent (in the week of October 4). However, this did not translate to reported increases in revenue. The most frequent answer in Phase 2 was “No change.” This trend is consistent with an increase in the share of businesses perceiving “Little or no effect“ from the pandemic, observed in Phase 2.
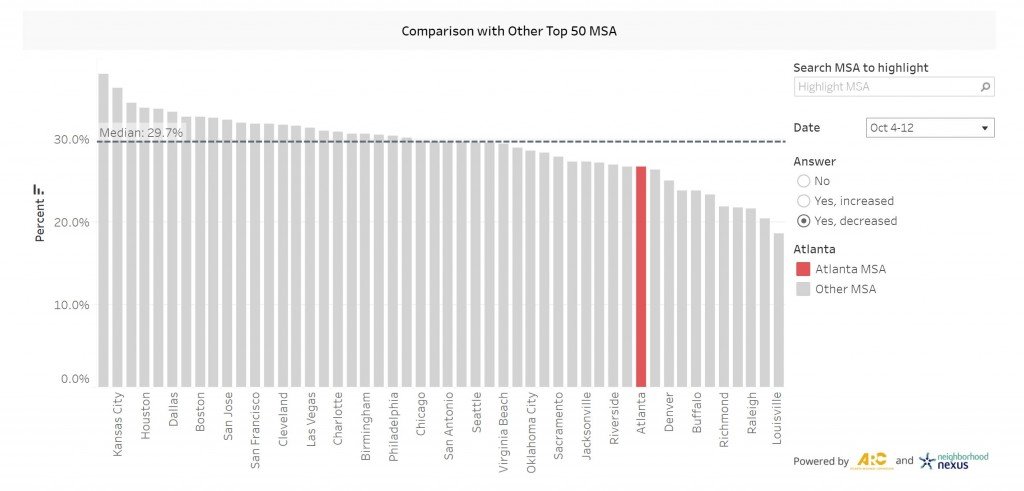
How has Atlanta compared to the other top 50 MSAs? The graph above shows that share of Atlanta small businesses perceiving a “revenue decrease“ was below the median value for the top 50 MSAs in the week of October 4. Considering that share of Atlanta businesses perceiving a “revenue decrease” was right at the MSA median value for in the week of April 26 (Phase 1), it appears that Atlanta has had some level of revenue stabilization and recovery.
To sum up, fewer Atlanta small businesses are experiencing a severe revenue drop from COVID-19 than they were at the start of the pandemic. Also, the pace of small business recovery in Atlanta is faster than that in the other top 50 MSAs. Check out the dashboard to see in which MSAs small businesses are recovering faster than they are in Atlanta, among other things.
Other Selected Highlights from the Small Business Pulse Survey:
- As we got deeper into the pandemic, especially in Phase 2 (August through October), small businesses in Atlanta have had fewer closures related to COVID-19. The small business closure rate in Atlanta is in general equal to or lower than the median closure rate across the top 50 MSAs.
- Most small businesses in Atlanta did not reduce their number of employees; the share of businesses that cut jobs dropped from late April through October, though there are almost no changes in the share of businesses that hired new employees.
- Although more than 50 percent of small businesses reduced employee hours in late April, the share of businesses cutting hours dropped to almost 20 percent by October. Although Atlanta businesses were least likely to increase working hours (as opposed to other reactions), the share that did increase hours was still above the related median for the top 50 MSAs
- The share of businesses missing loan and other payments has declined during the course of the pandemic.
Check out the dashboard for (much) more information.