As May turns to June, we have one more “Month” designation that absolutely must be mentioned. Asian in-migration has been a key driver of diversity over the last few decades in our 11-County ARC Region, and each May is Asian American, Native Hawaiian, and Pacific Islander Heritage (AANHPI) Month
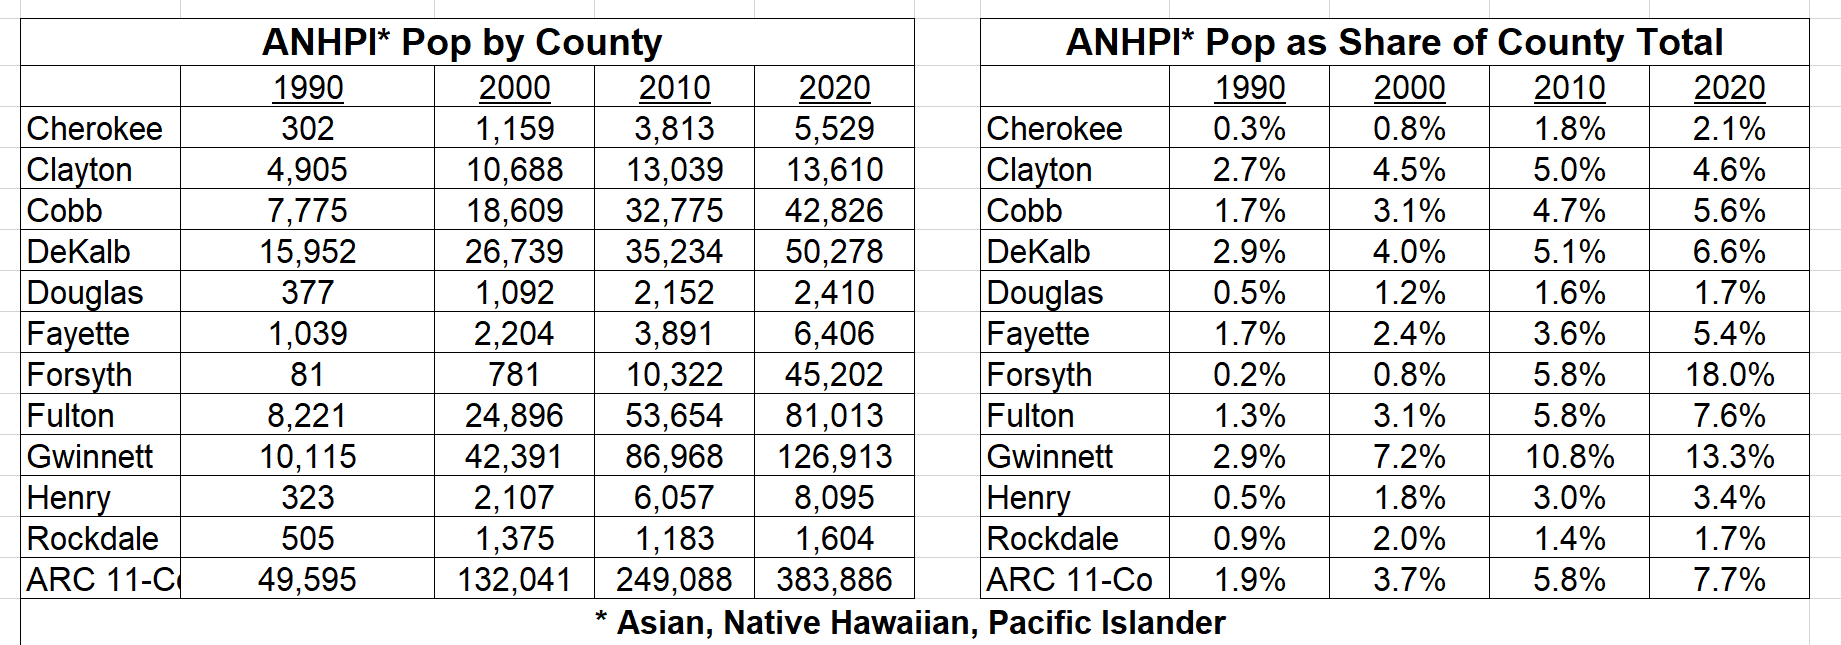
The data are simply dramatic. Figure 1 below tracks the absolute increase and share capture trends by county (as well as for the region as a whole) . In five of the region’s 11 counties, AANHPI population increased five times over (or more) between 1990 and 2020. Words don’t really work to talk about the increase in Forsyth County, where there were 81 Asians in 1990, but over 45,000 by 2020. Forsyth went from the lowest share (across the 11 counties) of AANHPI population in 1990 (at 0.2%) to by far the highest share (18%) in 2020.
Figure 1: Trends in Asian American, Native Hawaiian and Pacific Islander Population: Totals and Shares (Source: US Census Bureau; ARC RAD)

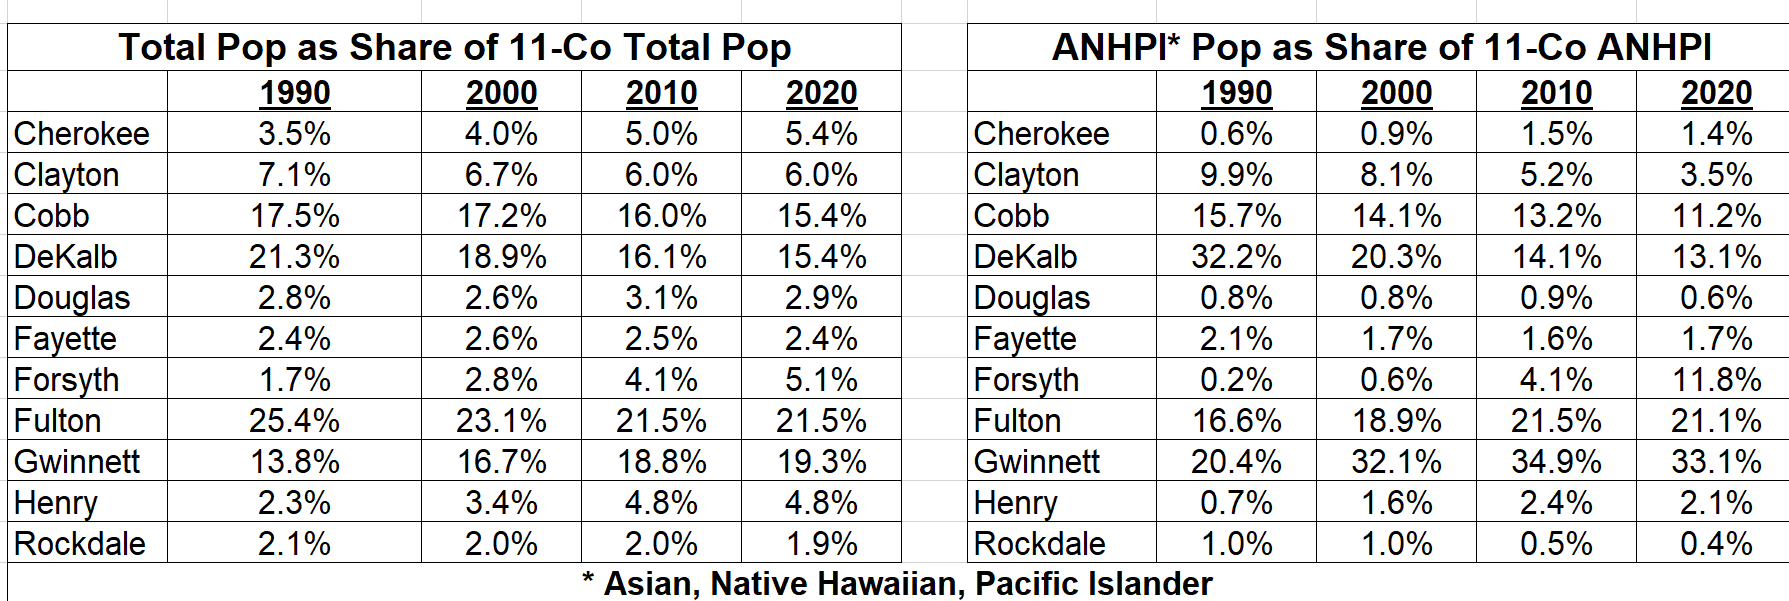
Figure 2 is a good way to assess relative concentrations of this group across the region’s counties, relative to the population as a whole. in 1990, about one-third of the region’s approximately 50,000 ANHPI persons lived in DeKalb, but the county’s share of all 11-County ANHPI population dropped to 13% by 2020. Cobb’s ANHPI share also declined from 1990 to 2020, but the opposite pattern is present for Fulton and Gwinnett (and…not surprisingly…Forsyth).
Figure 2: The Surging Shares of Asian American, Native Hawaiian and Pacific Islander Population by County (Source: US Census Bureau; ARC RAD)

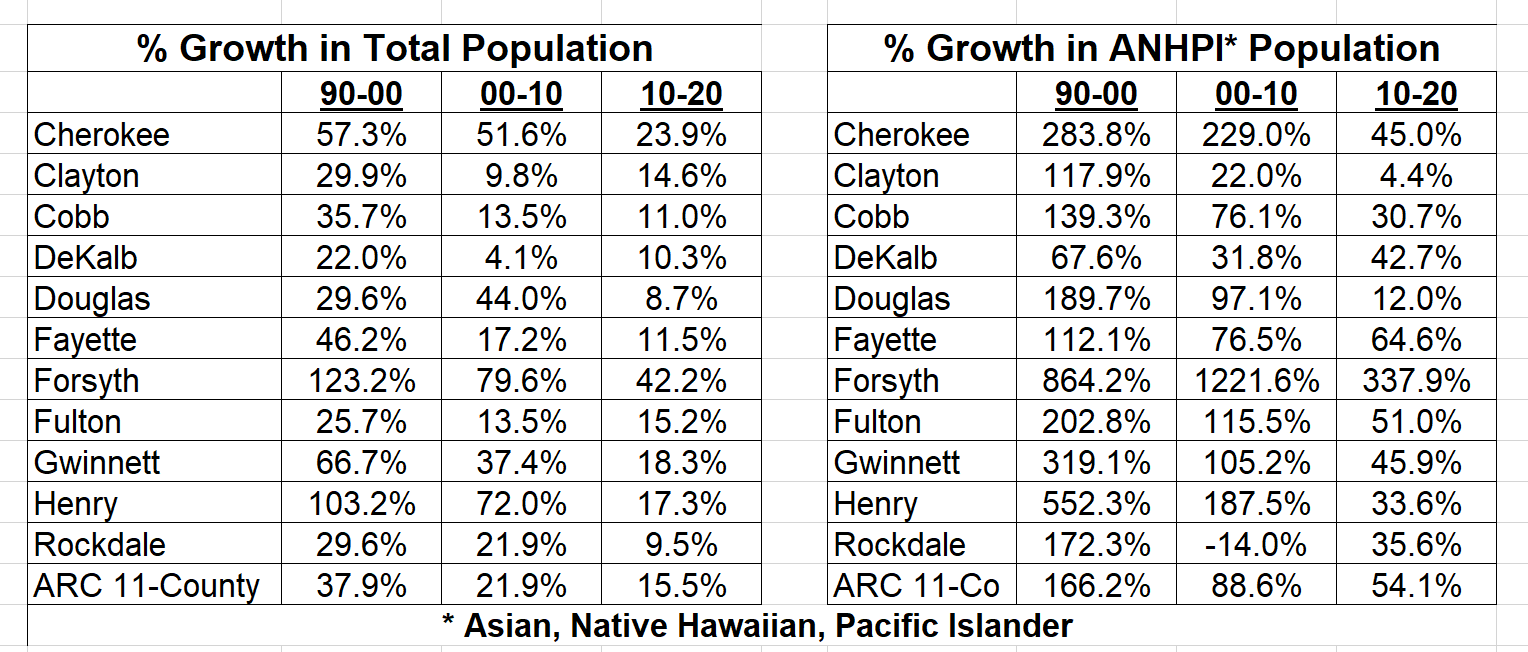
To close, Figure 3 below illustrates the vastly higher rates of growth in the Asian population, when compared to the population as a whole. The growth rate in AANHPI population exceeds the total growth rate in all areas and periods save two: Rockdale from 2000-2010 and Clayton from 2010-2020. From 1990-2000, Asian population doubled in all counties except DeKalb, the county with the largest regional share of AANHPI population in the base year of 1990. Even after the explosive increases of the 1990s, Asian population doubled again in half of the region’s counties 2000-2010.
Figure 3: The Rapid (Growth) Rates– Asian American, Native Hawaiian and Pacific Islander Population 1990-2020 (Source: US Census Bureau; ARC RAD)


