
Commuters driving through Atlanta may be experiencing slower speeds and more congestion following the I-85 bridge collapse; here, we analyze travel conditions on specific roadways for Monday, April 10.
With school back in session after last week’s spring break, we are evaluating changing travel patterns by using INRIX real-time traffic software to compare travel speeds on selected corridors throughout Atlanta. While many metro residents are taking transit or teleworking, these data looks solely at automobile trips.
Check back to see new trends as we add corridors and updated data.
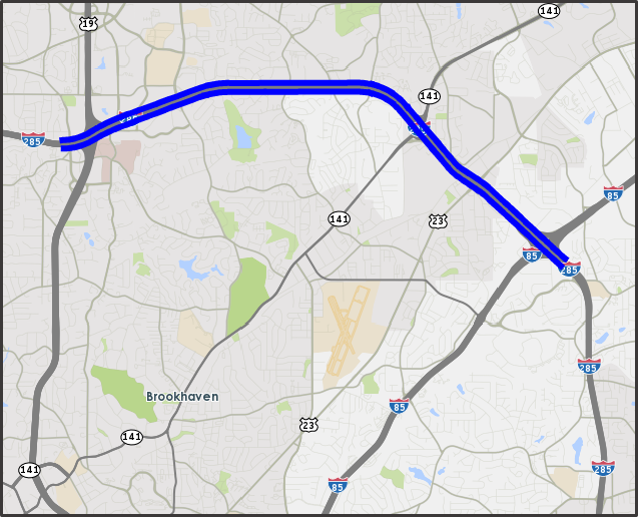
I-285 (GA 400 to I-85):
As more commuters use I-285 to get around Atlanta, we are seeing a decrease in travel speeds. These charts compare travel speed for the section of I-285 from GA 400 to I-85. Clockwise (traveling from 400 to I-85) and counterclockwise (traveling from I-85 to 400) travel speeds are analyzed, by hour.
The orange lines on the chart show travel speed by hour for Monday, April 10. To compare if traffic was faster or slower than average, reference the blue lines, which show the historic average speed for the same day/time.
When we look at travel speeds going counter-clockwise (first chart), Monday’s speeds are slower than “normal” (normal meaning the historic average speed) nearly all day.
The potential impact of increased congestion is most apparent in the evening rush hour, as shown by the difference between the orange and blue lines. At 5:00 PM in the evening, traffic moving counter-clockwise from I-85 to GA 400 was traveling at 16 MPH, much slower than the normal speed of 43 MPH.
During morning rush hour at 8:00 AM, traffic was moving at 16 MPH, compared to the normal speed of 24 MPH.

Traveling clockwise (second chart), we can see that evening rush hour is starting earlier around 3:00 PM.

Moreland Ave:
One corridor that has been heavily impacted by changing travel patterns is Moreland, potentially due to more commuters traveling through town to avoid the interstates. These data show travel speeds on Moreland from I-20 to Ponce de Leon. Both northbound and southbound travel speeds are analyzed, by hour.
The orange lines on the chart show travel speed by hour for Monday, April 10. To compare if traffic was faster or slower than average, reference the blue lines, which show the historic average speed for the same day/time.
The first chart shows northbound travel speeds, which were below average all day. During morning rush hour traffic was moving about half as fast as “normal” (normal meaning the historic average speed). At 8:00 AM, traffic was moving through this corridor at about 7 MPH, while typically, the average speed at this time is about 15 mph.
Even during non-rush hour periods traffic was moving slow. At 2:00 PM traffic speed was about 9 MPH, significantly slower than the normal speed of 23 MPH.


Traffic was also moving slower than normal traveling southbound on Moreland for most of the day, except for around 4:00 PM. These differences aren’t as significant as northbound travel, but we are still seeing a decrease in speeds.
The morning rush hour was slower than normal, compared to the evening rush hour; travel speeds around 8:00 AM southbound were 18 MPH, compared to a normal speed of 24 MPH.
