Transportation Tuesday: Georgia Teen Drivers

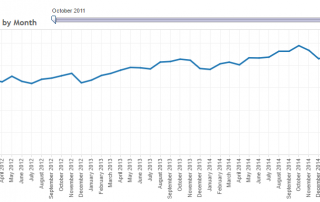
The number of teens drivers has hit a record low, according to data from the Federal Highway Administration. In 2014, there were about 8.5 million teenage drivers in the U.S. How does this trend look for Georgia drivers? Source: U.S. Department of Transportation Federal Highway Administration, Highway Statistics Series

By |2016-12-08T15:24:52-05:00July 12th, 2016|Transportation, Transportation Tuesday|Comments Off on Transportation Tuesday: Georgia Teen Drivers

Transportation Tuesday: May’s Worst Traffic Jams

Now we can relive the worst traffic jams of May 2016! The top 10 bottlenecks for the month are shown here, with details about duration, length, and number of occurrences. For the second month in a row, the #1 bottleneck was I-75 N @ Chastain Rd/exit 271. The average maximum length of this bottleneck was 11.82 miles [...]

By |2016-06-07T19:25:55-04:00June 7th, 2016|Transportation, Transportation Tuesday|Comments Off on Transportation Tuesday: May’s Worst Traffic Jams

Transportation Tuesday: I-85 HOT Lane

This dashboard, from the Atlanta Regional Transportation Factbook, shows data on I-85 HOT (High Occupancy Toll) lane usage. The HOT lanes offer more reliable trip times for a small variable toll. This data shows the average weekday trips by month and the average daily fare by month since the HOT lane's opening in October 2011. [...]

By |2016-12-08T15:25:14-05:00May 17th, 2016|Transportation, Transportation Tuesday|Comments Off on Transportation Tuesday: I-85 HOT Lane

The Impact of Transportation on Air Quality in the Atlanta region

  With the hot summer months approaching and impacting air pollution levels in the region, we wanted to dive into ARC's research on air quality and assess the most impacted areas in our community for this month's Regional Snapshot. Take a look at the highlights below, and check out the full report here. The Clean [...]

By |2016-12-08T15:25:14-05:00May 12th, 2016|Public Health, Regional Snapshot, Transportation|Comments Off on The Impact of Transportation on Air Quality in the Atlanta region

Transportation Tuesday: Vehicle Availability & Commuting to Work

Atlanta Regional Commission recently discussed commuting data with U.S. Census Bureau Director John Thompson. Household commuting statistics, such as means of transportation to work, come from the American Community Survey and are available at various geographies. The data highlighted below looks at how commuting in the metro Atlanta region compares to other areas and where households with no [...]

By |2016-12-08T15:25:14-05:00May 10th, 2016|Transportation, Transportation Tuesday|Comments Off on Transportation Tuesday: Vehicle Availability & Commuting to Work

Transportation Tuesday: April’s Worst Traffic Jams

Relive the worst traffic jams of April 2016! The top 10 bottlenecks for the month are shown here, with details about duration, length, and number of occurrences. The #1 bottleneck was I-75 N @ Chastain Rd/exit 271. The average maximum length of this bottleneck was 8.5 miles with an average duration of 2 hours and [...]

By |2016-12-08T15:25:15-05:00May 3rd, 2016|Transportation, Transportation Tuesday|Comments Off on Transportation Tuesday: April’s Worst Traffic Jams

Transportation Tuesday: Traffic Signals in Metro Atlanta

Take a guess at how many intersections with traffic signals there are in metro Atlanta! Atlanta Regional Commission has the answer: As part of the new Regional Dynamic Traffic Assignment project through the Strategic Highway Research Program, ARC has identified signalized intersections in the 20-county metro Atlanta region.

By |2016-12-08T15:25:15-05:00April 19th, 2016|Transportation, Transportation Tuesday|Comments Off on Transportation Tuesday: Traffic Signals in Metro Atlanta

Transportation Tuesday: Atlanta Regional Transportation Plan

This interactive map shows the projects included in the Regional Transportation Plan, key components of The Atlanta Region's Plan that was adopted in February by the ARC Board. Red = Transit Projects Purple = Roadway Projects Green = Last Mile Connectivity Projects Orange = Other Projects Zoom into the map and click on individual projects to [...]

By |2016-12-08T15:25:17-05:00April 5th, 2016|Transportation, Transportation Tuesday|Comments Off on Transportation Tuesday: Atlanta Regional Transportation Plan

Transportation Tuesday: Travel Time to Work

How long does it take you to get to work? This map uses 2010-2014 American Community Survey census tract data to highlight the areas that have the longest average commute, ranging from 34-45 minutes. Most of the concentrations occur outside of the urban core in counties such as Henry, Gwinnett, and Paulding (nearly all of Paulding [...]

By |2016-12-08T15:25:17-05:00March 29th, 2016|Transportation, Transportation Tuesday|Comments Off on Transportation Tuesday: Travel Time to Work
Go to Top