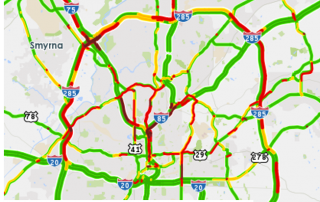
Changing travel patterns: Current and historic speeds on select roads
Commuters driving through Atlanta may be experiencing slower speeds and more congestion following the I-85 bridge collapse; here, we analyze travel conditions on specific roadways for Monday, April 10. With school back in session after last week's spring break, we are evaluating changing travel patterns by using INRIX real-time traffic software to compare travel [...]