Regional Snapshot: The Rental Housing Market
How expensive is rental housing in Atlanta's compared to elsewhere in the country? This Snapshot takes a look at data from Costar, Zillow, and elsewhere to analyze the cost of the local rental market.

How expensive is rental housing in Atlanta's compared to elsewhere in the country? This Snapshot takes a look at data from Costar, Zillow, and elsewhere to analyze the cost of the local rental market.
Rental rates around Atlanta have been on the rise - but what geospatial patterns do we see at a census tract level?
Rental rates around Atlanta have been on the rise - but do rental rates seem to correlate with income or age?
Rental rates around Atlanta have been on the rise - but where specifically? And by how much?
Want more information on costs of living? There are other indicators to consider! This post looks into a purchasing power index and cost indices by type of purchase that extend the previous analysis of the C2ER Cost of Living Index Snapshot.
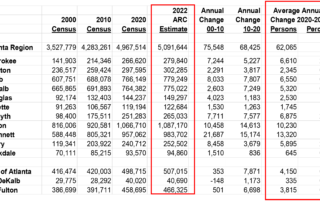
ARC's 2022 population estimates find that the region had a better growth this year than last year...find out how much better, and why...
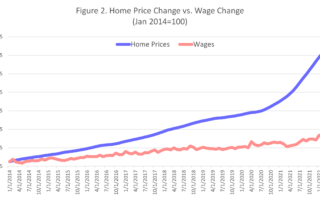
What are the wages of relatively slow wage growth mixed with soaring home prices in our area? Diminished housing affordability
The ARC LINK trip to Austin, TX is this week (May 2-6, 2022). And we just updated our 100 Metros Dashboard. Let's compare Atlanta to Austin!
Redlining played a large part in shaping geographies of exclusion for homeownership in America. This StoryMap explores Atlanta's present segregation and inequality and compares them against historic redlining maps.
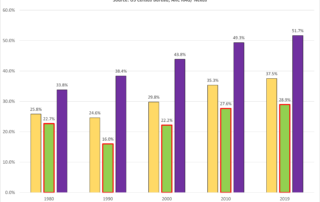
Our Black population is significantly lss likely to own a home than the population as a whole. While this gap has stayed present since 1980, it has narrowed, particularly in the 1990-2010 period.